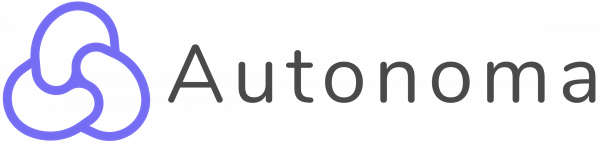
Metrics of a datastream
The most important metrics can be added to a data stream, such as maximum, minimum, average, etc. This gives you an even better overview of your asset. This gives you an even better overview of your asset. These key figures adapt to the set time interval.
The data stream thus offers you a valuable way to manage your data and get the full benefit from your resources.
The metrics can be found on the detail page of a data stream. New ones can be created, deleted or edited there.
Create a new metrics widget
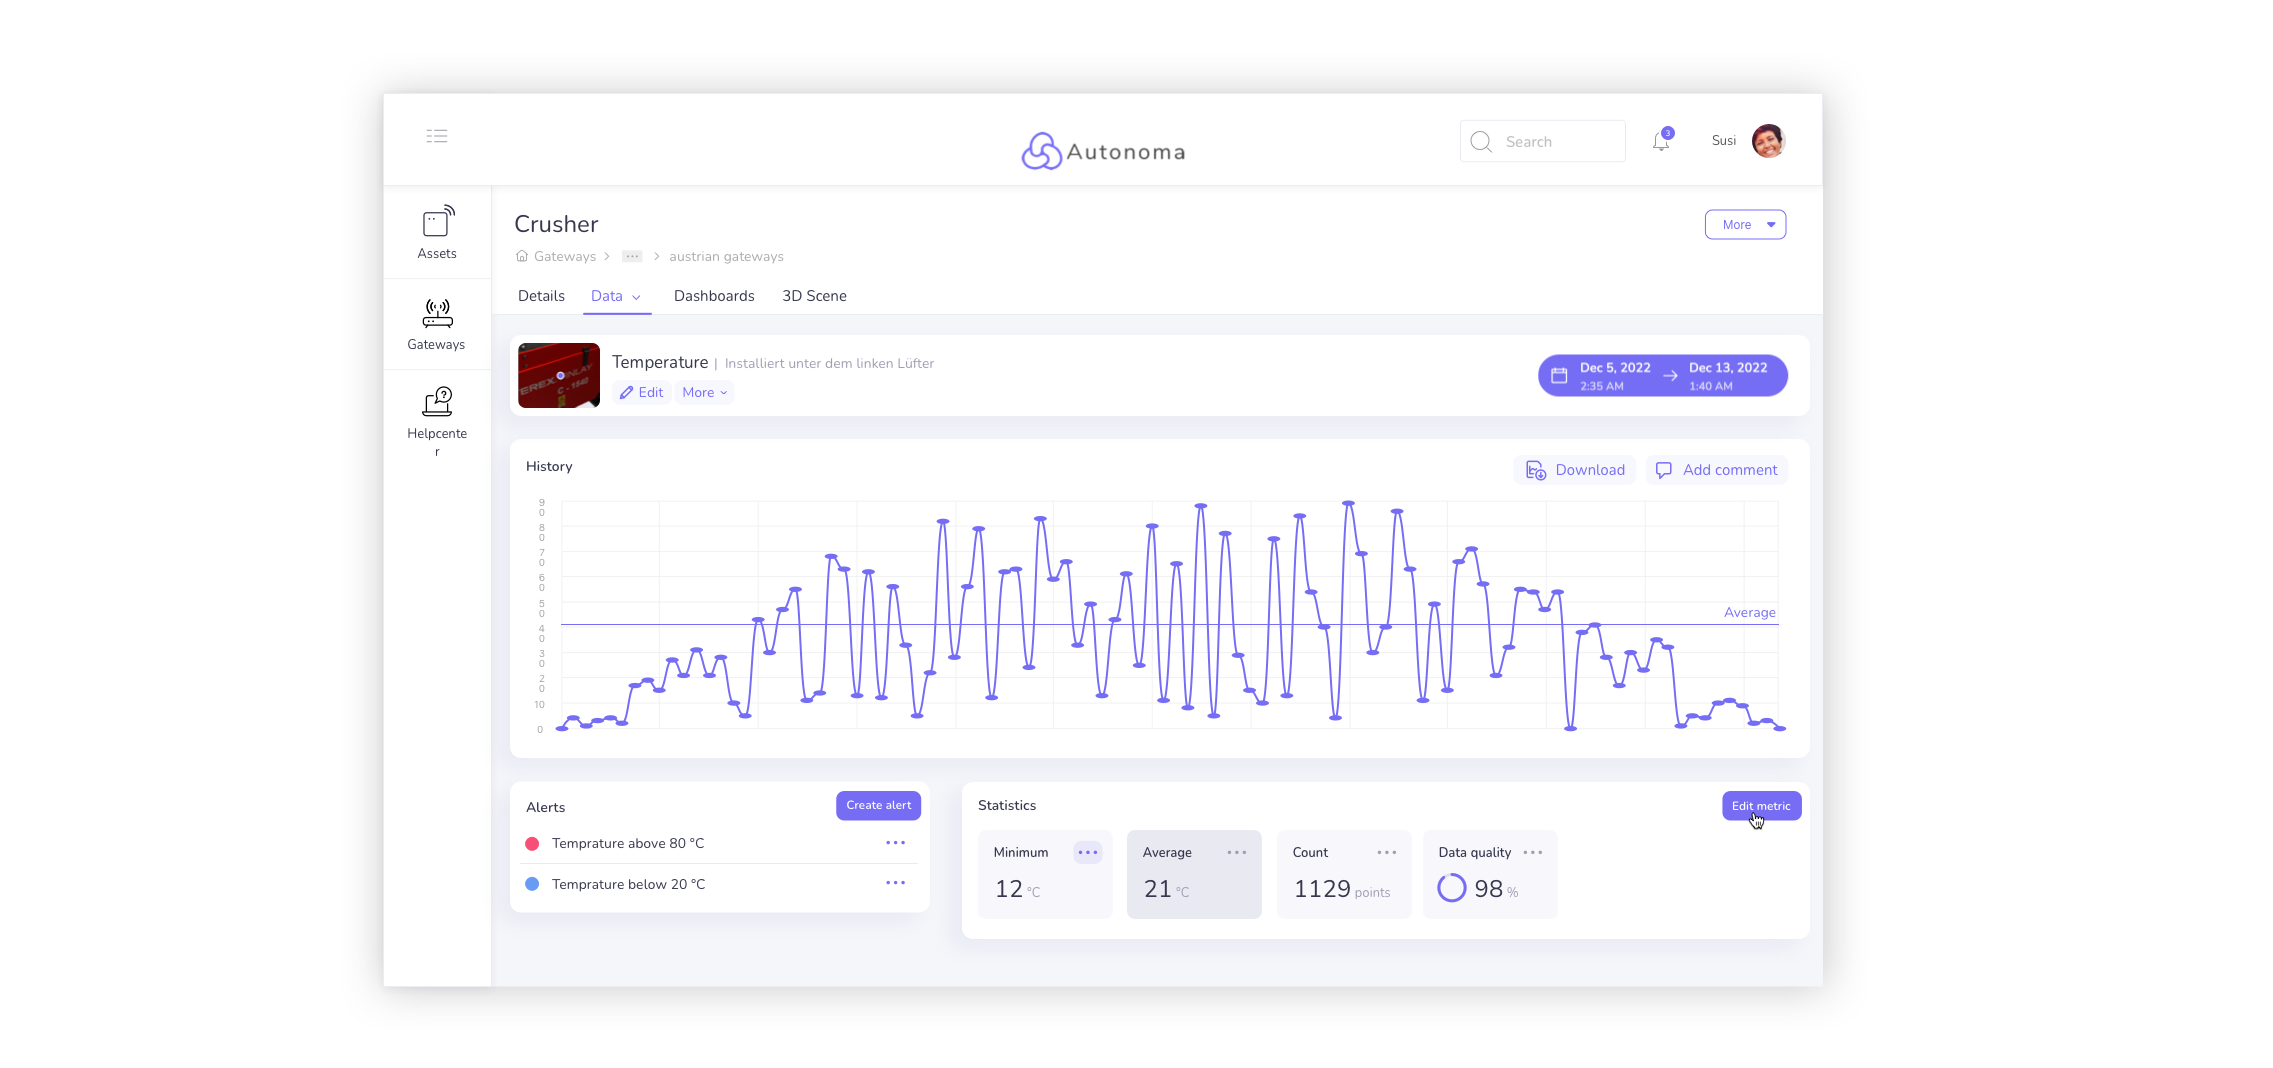
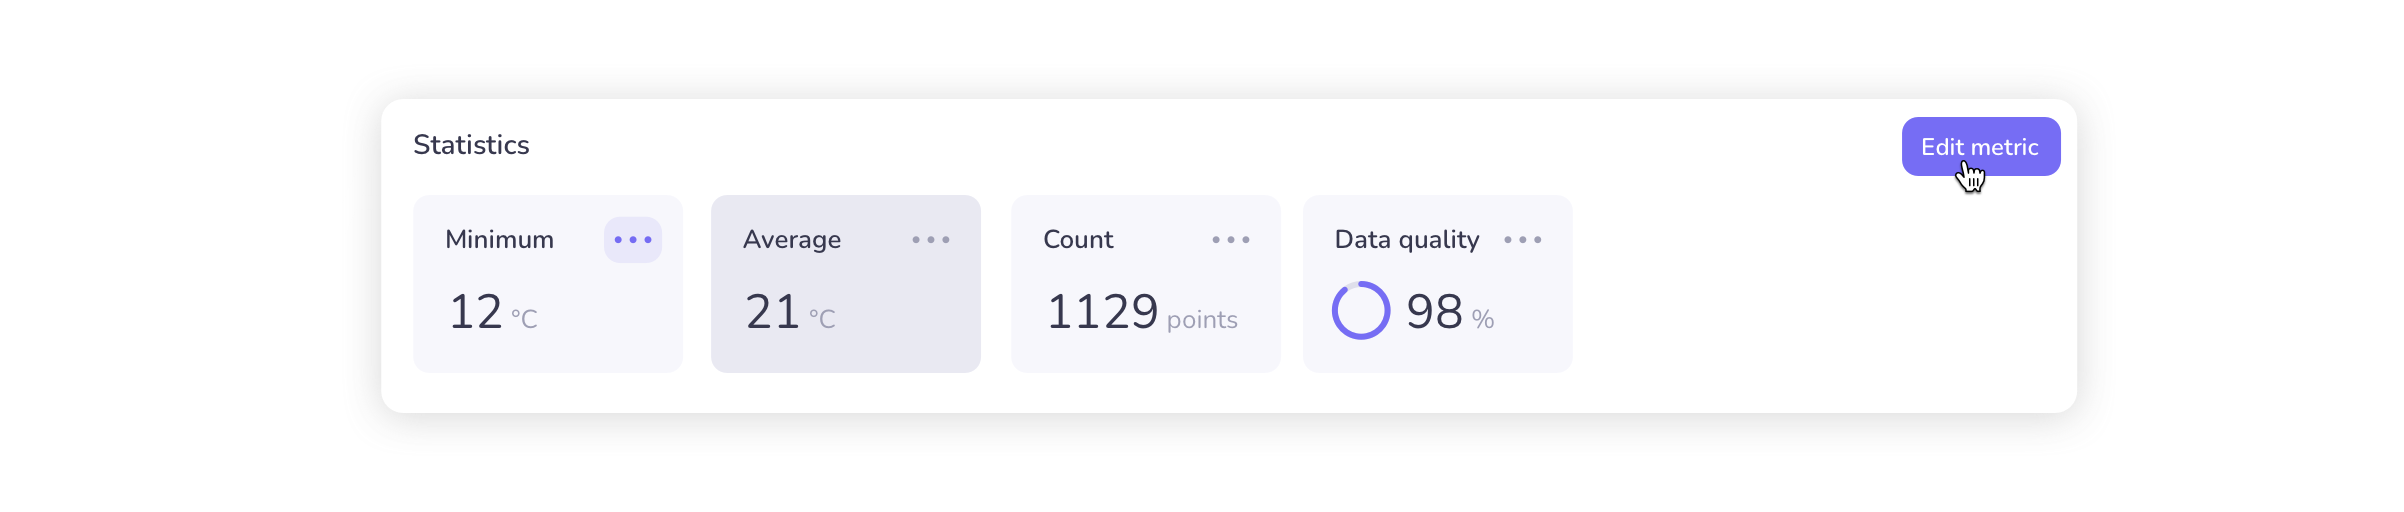
To begin, click on the button "Edit metric". This opens the editing mode of this statistical widget. The field "Add metric" opens the creation mask of a new metric.
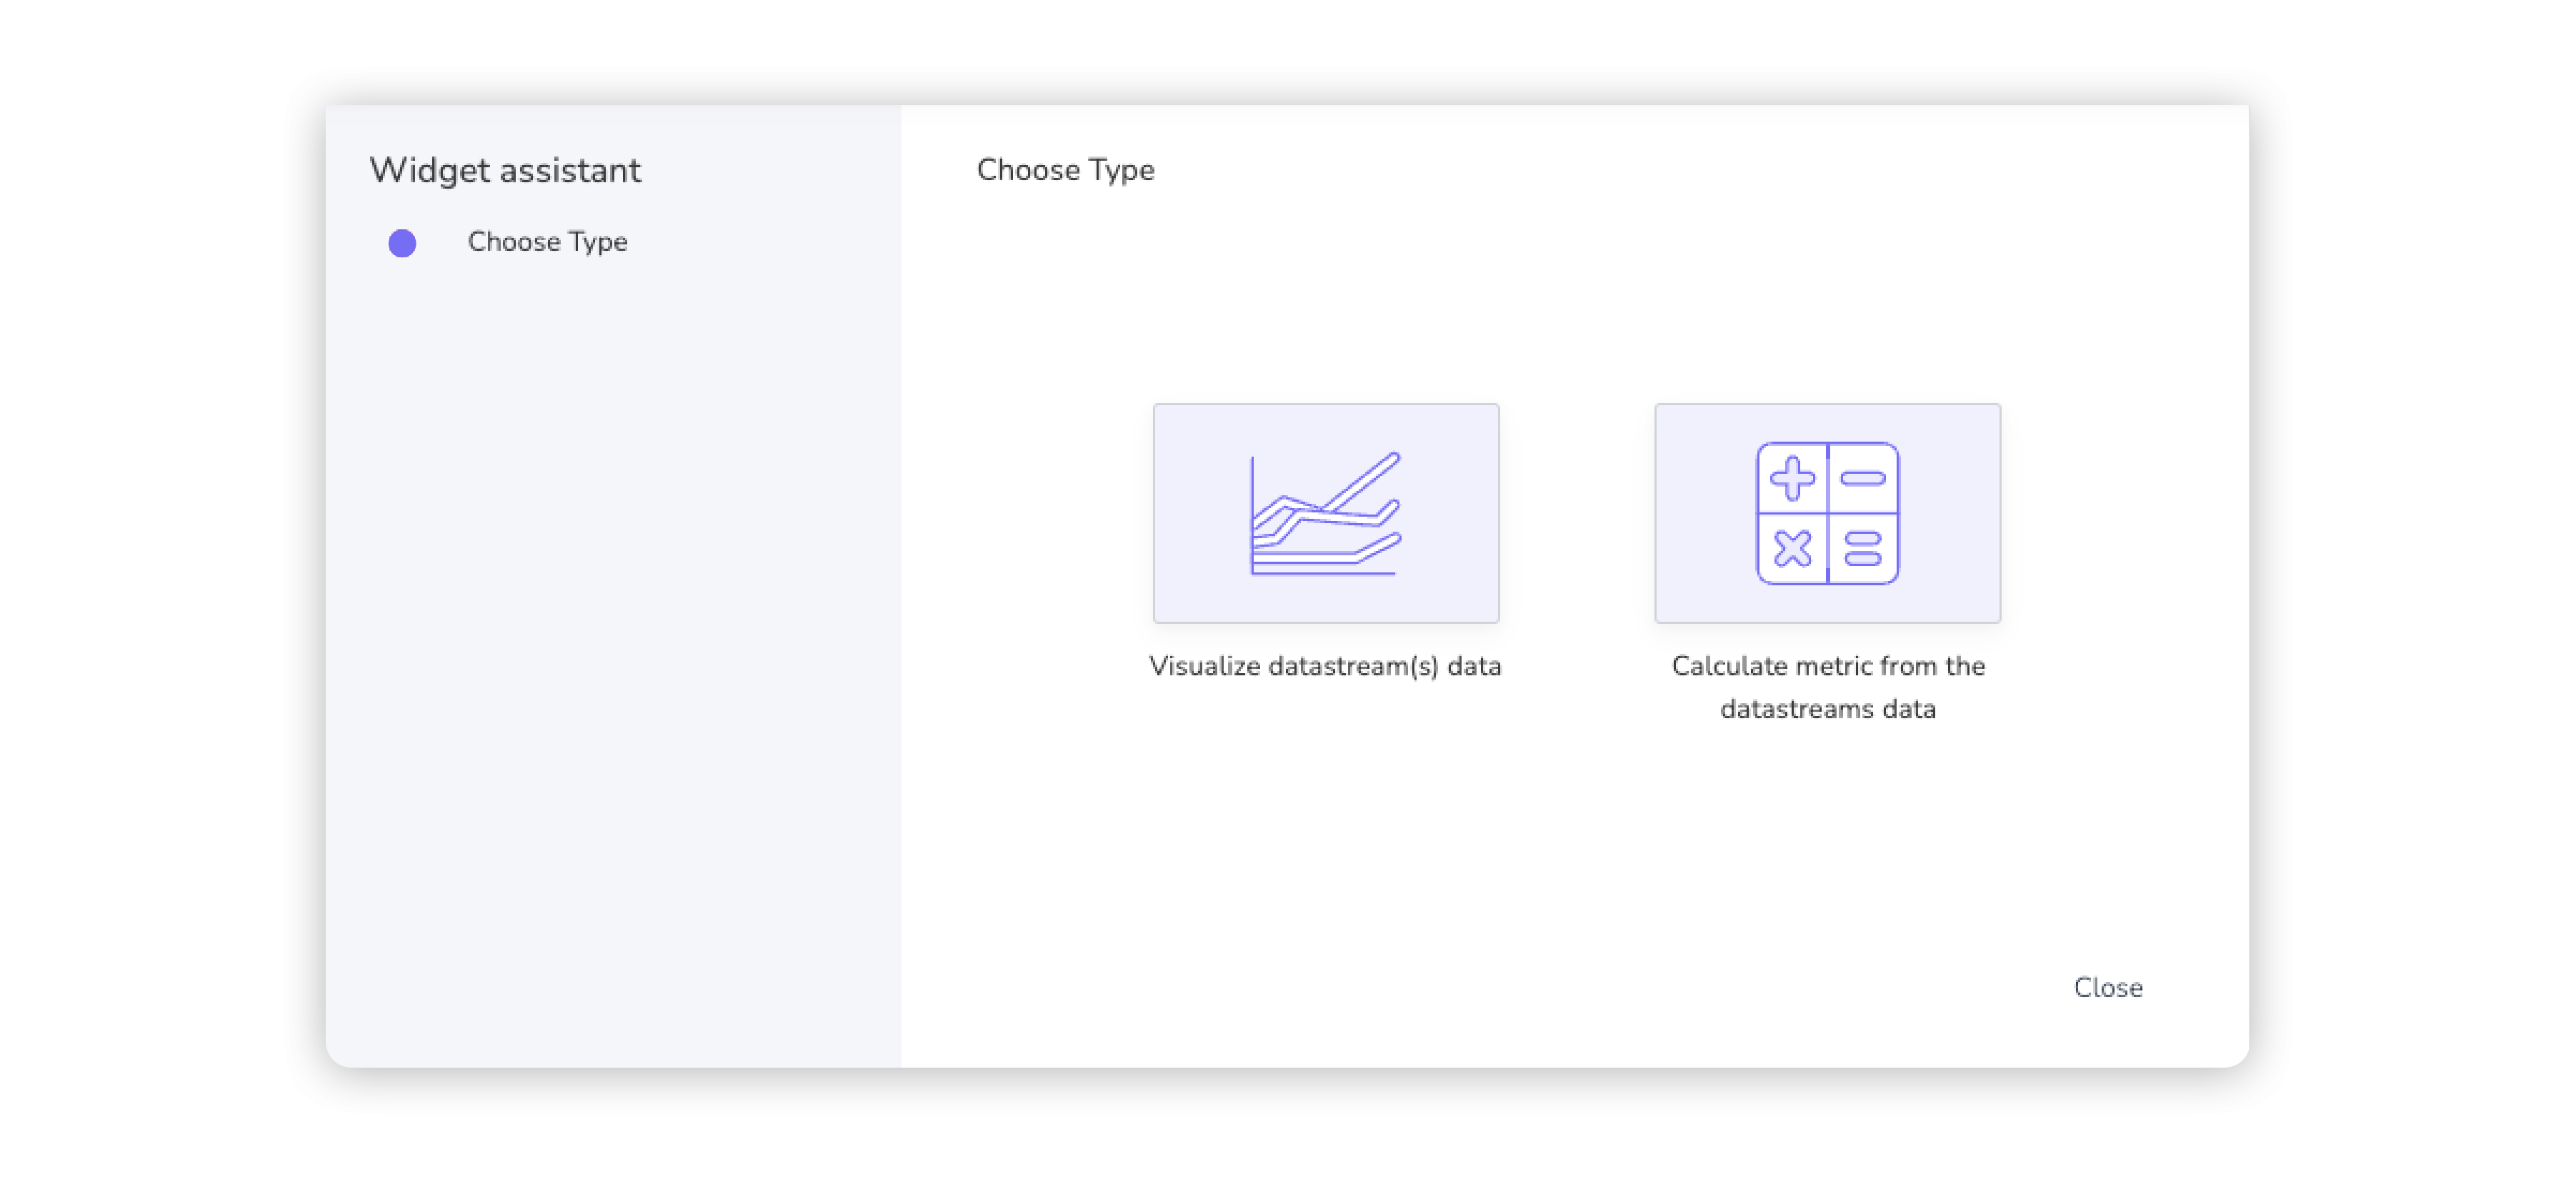
Here you first select whether you want to add a visualization of a data point or a calculated metric.
Haven't found the answer? We can help.
Submit a requestContact us and we’ll get back to you as soon as possible.